


MLOps in Practice— Have you ever monitored your ML driven systems?
Monitoring plays a fundamental role in any solid ML solution architecture.

👋 Hi folks, thanks for reading my newsletter! My name is Yunna Wei, and I write about modern data stack, MLOps implementation patterns and data engineering best practices. The purpose of this newsletter is to help organizations select and build an efficient Data+AI stack with real-world experiences and insights and assist individuals to build their data and AI career journey with deep-dive tutorials and guidance; Please consider subscribing if you haven’t already, reach out on LinkedIn if you ever want to connect!
In my previous article, MLOps in Practice — De-constructing an ML Solution Architecture into 10 components, we walked through the 10 critical components to build an end-to-end ML system. One of the 10 components is monitoring, particularly after the ML model is deployed in a production environment. Therefore I would like to use today’s article to specifically talk about how to build a robust monitoring mechanism for an ML driven system.
I will first talk about why monitoring your ML driven systems is important and necessary. But the the majority of today’s article will be about the three key components required in order to build a robust monitoring solution for your ML systems:
System Monitoring
Data Monitoring
Model Monitoring
Let’s get started!

Why monitoring your ML driven systems is important and necessary?
ML driven systems are built from, and learnt from, data. When the underlying data changes, the ML model and algorithm also need to be updated accordingly. ML driven systems are always in a continuous-change state, and there is really no ending. Therefore, monitoring both data changes and model performance changes, becomes very necessary. The faster the business environment and data changes, the more necessary it is that the ML model is “re-trained” and “re-learnt”.
Therefore, the ultimate goal of monitoring ML systems is to give data scientists, ML engineers and system engineers the opportunities to track the performance of their models over time, detect and diagnose issues, and take corrective action before they cause major problems in a production environments.
Specifically, monitoring ML-driven systems can serve the following purposes:
Make sure high-quality data is fed in, for both model training and model prediction pipelines
Monitor how data changes over time, to see if any potential “drifting” (in the underlying statistical distribution) is occurring
Provide support for production model debugging and performance tuning — if the ML model is underperforming, you can leverage the monitoring data to explore and interpret the details of changes in the input data, or debug the quality issues
Decide on the model retraining — before feeding fresh data into the model, you might want to verify whether it even makes sense to do so. If there is no data drift and the environment is stable, then retraining might not be necessary.
Send alerts for business critical ML-driven applications when there are error(s) detected, or any potential issue is identified, to minimize application down time.
The key components of building a robust monitoring solution for ML-driven systems

There are 3 key components of a complete monitoring solution for a ML-driven system:
The first is, system monitoring — generally ML models are packaged as part of an application, such as a web application. Therefore, system monitoring focuses on the metrics that evaluate the performance and stability of the application, such as the response time of the web applications, the number of requests being processed, the number of errors being generated, as well as compute resource utilization metrics, including CPU usage, memory usage, and disk usage.
The second is, data monitoring — data monitoring focuses on checking data quality / integrity issues and detecting potential data drift problems that can cause models to become less accurate, and even lead to poor performance in production.
The third is, model monitoring — model monitoring focuses on validating model predictions results, understanding how model performance metrics decay, checking model prediction drift, as well as evaluating if the learnt relationships between model features and the model target have changed dramatically.
Let’s discuss each of these 3 components in detail.
System monitoring
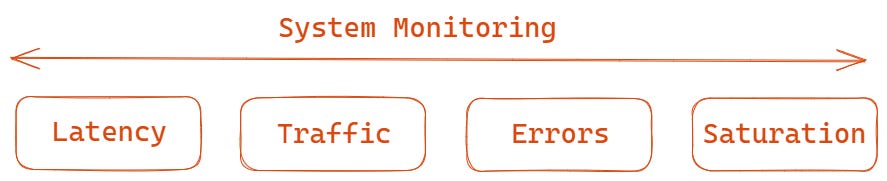
The system monitoring can be divided into the following 4 aspects:
Latency — Latency refers to the time it takes to respond to an ML prediction request. It is necessary to monitor the latency within the context of Service Level Agreement (SLA) to make sure ML prediction latency can meet the demand of a particular business scenario.
Traffic — Traffic refers to a measure of how much demand is being placed on your system, measured in a high-level system-specific metric. For scenarios where a ML model is packaged as a REST API or embedded into a web application, traffic measurement is usually HTTP- requests-per-second. For scenarios where an ML model is used for batch predictions, traffic monitoring could mean the monitoring of the data volume of each batch to see if there are any throughput spikes, requiring the underlying compute to be scaled up to accommodate such situations.
Errors — The number of errors being generated. Different from traditional software applications, for ML-driven systems, the errors can be categorized into two categories — explicit errors and implicit errors. Explicit errors are those like bugs in the code, hardware failures, runtime errors as well as network errors. Implicit errors refer to ML model prediction accuracy and validity. Let’s take a classification mode as as example. Although the model can make predictions, the prediction probability is (an unreasonable) 100%, which is definitely a very concerning alarm. It is frankly, too good to be true. I would consider this type of scenario, an implicit error.
Saturation — Saturation refers to system resource utilization ratio, such as memory, CPU and I/O utilization monitoring, emphasizing the resources that are most constrained and understanding the stability and performance of the underlying hardware. Symptoms of system saturation can include slow performance, unresponsive applications, system crashes, and data loss. Therefore, it is important to plan for scalability and to have a disaster recovery plan in place.
Data monitoring
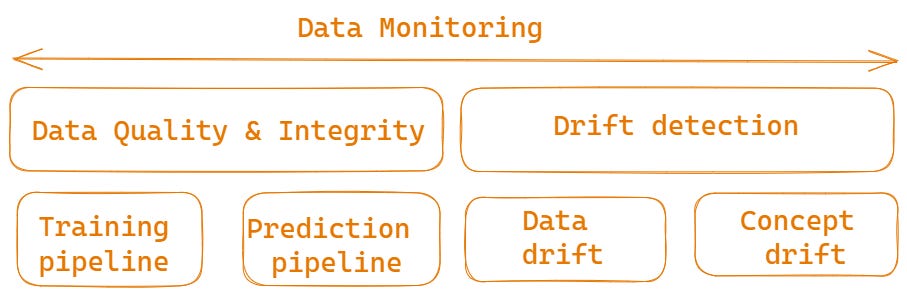
Data monitoring can be divided into 2 categories — one is data quality / integrity checks, and the other is drift detection.
Data quality / integrity checks monitor if both the training data and production data meet the data expectations and ML model input expectations. Here I will divide the data quality checks into two categories, as they focus on different aspects — one is for training data and the other is for production data.
For training data used for model training pipelines, these checks include missing data checks, data duplication checks and outlier checks. Also, data quality checks include such things as checking if a column has only one single value, checking if identical samples have different labels, checking feature/feature correlation, checking feature/label correlation, comparing training data and test data, checking train/test feature drift, train/test label drift, train/test samples mix and train/test data leakage.
For production data for model prediction pipelines, the data quality and integrity checks focus on making sure the input production data matches with the required schema of the ML model.Data drift detection focuses on understanding the gradual changes in the statistical properties of a dataset over time. Data drift is one of the top reasons why machine learning model’s performance degrades over time. Therefore, it is very critical to capture and monitor data drifts. Drift detection is done by comparing the newer and older data, and seeing whether they are derived from the same underlying distribution. You can take one variable at a time (that can either be a data feature, the label, or even the prediction) and measure the differences between newer and older samples of the variable. If you want to uncover co-variate drift, you can train a domain classifier to classify whether a sample came from the trained dataset or the newer (test or production) dataset. If the classifier can easily predict which sample is from which dataset, it would mean that there are significant differences between these datasets.
Model monitoring

In the end-to-end MLOps workflow, there are two stages for model monitoring, the first is the model evaluation stage (before an ML model is deployed into a production environment) and the second of the two is the model prediction stage (after a ML model is deployed into a production environment)
At the model evaluation stage, model monitoring checks the following aspects:
Model overfitting — checking if the model is overfitted on the training data. Overfitting should be the first thing to be checked after a ML model is trained.
Model performance by segments — Monitor model performance metrics by segments. The check can help you easily identify the model’s weakest segments in the data provided. It narrows down the scope of model debugging and performing tuning and gives data scientists a good clue in terms of where to work on in order to further improve the model performance.
Key model performance metrics for classification models including model calibration score, confusion matrix, ROC report and so on
Key model performance metrics for regression models including mean absolute error (MAE), mean squared error (MSE), root mean squared error (RMSE), regression error distribution and so on
At the model prediction stage, model monitoring checks the following aspects:
Model prediction results validation — validating if the returned result from an ML model prediction is valid or not. Let’s take a classification model as as example, if the model’s prediction probability is always 100%, it is definitely something worth investigating.
Model prediction drift detection — Prediction drift is when drift occurs in the prediction itself. For scenarios where ground truth is available, you can not only monitor the changes of prediction results, you can also contrast the predicted values to the true values to see if there any concerning difference. Calculating prediction drift is also very useful in cases in which labels are not available for the production dataset, and so a drift in the predictions is our only indication that a change has happened in the data that actually affects model predictions.
Learnt relationship drift detection — Check if the statistical relationship between the ML features and labels has remained the same as well as if the feature importance has changed over time. If there is drift detected, it could be a strong signal for potential model retraining.
Model prediction time — measures the model’s average inference time (in seconds) per sample. Inference time is an important metric for prediction models, especially in real-time applications and data streaming processes, where a fast run-time can affect the user experience or the overall system load.
In the end, I think it is worthwhile mentioning that the key components of an ML monitoring solution can vary depending on your ML deployment patterns and the business contexts of how your ML models are used. For example, for batch deployment, system monitoring is not as necessary as it is for an online deployment where the ML model endpoints need to respond to a large volume of requests in a low latency manner. Therefore, in my opinion, it is most important that you know what metrics are most relevant to your ML systems before you actually start implementing the solution.
Summary
Building and fine-tuning models is exciting, but how do you know your model keeps performing in the way you carefully designed it and your production data has the same statistical characteristics and nature as your training data?
Deploying ML models to production without any monitoring in place is like flying a plane, but being blindfolded while doing so — it will stay in the air for a while, but over time, you will go off course and eventually crash.
It takes quite a bit effort to build a sophisticated ML monitoring solution. Therefore it is necessary to include monitoring in the MLOps solution as early as possible and make sure it is part of the ML deployment plan right from the beginning.
I hope this article can provide you with some thoughts and ideas about what your ML monitoring system looks like.
In my next a couple of articles, I will share some hands-on tutorials of embedding monitoring into both the ML training and prediction pipelines using open-source libraries like Evidently, deepchecks , whylogs and Mlflow. Please feel free to subscribed so that you can get notified when these articles are published. I generally publish 1 or 2 articles on data and AI every week.
Thanks so much for your support!
Thank you for highlighting the importance of MLOps and real-time monitoring. Your example of performance degradation due to user behavior shifts is a great reminder of why continuous feedback loops are essential. At Datumo, we support reliable AI with evaluation platforms—learn more at https://datumo.com Looking forward to more insights!